
The Program Reported Green. The Behavior Reverted Anyway.
Three metrics that would have caught it. None of them on most executive dashboards.

The dashboard reported green. Logins were above target. Training completion was above target. The sponsor sent a thank-you note to the program team. The behavior reverted anyway.
I have built dashboards that reported green. I have led steering committees that called the change a success while the team on the floor was already reverting. The framework that follows is the post-mortem.
What follows is not a complete diagnostic system. It is three metrics. They are the three I now look at first when I walk into any post-go-live engagement, and they are the three I would put on every steering committee deck if I could redesign the report from scratch.
Two are on every executive dashboard already. One is on none of them.
The Structural Problem
Most transformation dashboards track program execution. They report whether communications were delivered, training was completed, sponsors showed up at the town halls, milestones were hit on schedule. These are the metrics that get green-coded. They tell the executive that the program is running.
They do not tell the executive whether the organization became structurally different.
The metrics that would tell you that are usually visible to the practitioner team four to six weeks before they reach the executive dashboard — if they reach it at all. By the time the executive dashboard turns yellow, the operational signals have been visible to anyone close to the work for over a month. The gap between what the dashboard shows and what the practitioners know is where transformations quietly fail.
The three metrics below close that gap. They are operational, measurable, and difficult to fake. They tell you whether the new operating model is actually holding, whether people are still working outside the new system, and where rollback is happening.
One — Sustained Workflow Compliance
The question: Is the new operating model actually holding?
The metric: Percentage of transactions executed fully within the intended new system workflow ninety days after go-live and beyond. Not the number of users who logged into the system. Not the percentage who attended training. Transactions that completed inside the workflow path the design specified.
Green is above 90%. Yellow is 75% to 90%. Red is below 75%.
This is the cleanest indicator that the new operating model is actually doing the work it was built for. Logins prove people are entering the system. Workflow compliance proves people are doing the work inside it.
Most programs do not track this. They track logins, which can be high while compliance is low. They track active users, which counts anyone who touched the system in the last thirty days. They track training completion, which measures whether someone sat through a module, not whether they can perform the work afterward.
A program where logins are high and workflow compliance is below 75% is a program where people are entering the system because they have to and doing the actual work somewhere else. That is the signal. If compliance collapses after stabilization, the organization reverted.
I worked on a finance transformation where logins ran at 96% in month three. The sponsor was pleased. The finance leadership was preparing to declare the project complete. Workflow compliance was at 61%. The team was logging in to mark items reviewed in the new system, then doing the actual reconciliations in a spreadsheet they had built during the pilot. The spreadsheet tracked variance against the prior period in the format finance leadership had asked for over the previous three years. The new system produced the same data in a layout the team did not yet trust. So the team did the work twice — once in the system to satisfy the compliance metric, once in the spreadsheet to satisfy the work.
The system was reporting compliance with the activity. It was not reporting compliance with the work.
That spreadsheet is what the next metric is for.
Two — Legacy Workflow Utilization Rate
The question: Are people still working outside the new system?
The metric: Percentage of work still occurring outside the new system. Spreadsheets that should have been retired but are still active. Email approval chains that should have moved to the platform but did not. Shadow trackers that the team relies on instead of the system of record. Personal databases. Side processes. Anything that should not exist but does.
Green is below 5%. Yellow is 5% to 15%. Red is above 15%.
Shadow workflows are the clearest sign of structural rejection. They exist because the new system is harder, slower, or less trusted than the old habit, and the people doing the work found a path around the friction. Every shadow workflow is a small admission that the organization is rejecting the workflow the program installed.
I worked on an ERP go-live where the dashboard reported 94% adoption seventy-eight days post go-live. I sat with the CFO and the finance team for ninety minutes. We counted forty-seven active spreadsheets that should have been retired at cutover. Some were running reports the new system could have generated. Some were tracking exceptions the new system flagged but did not resolve. Some were quietly maintaining the legacy approval routes the program thought had been closed.
Forty-seven spreadsheets is not a training problem. It is a structural problem. The new system was not the easier path for the work the team actually had to do. The shadow workflows were the rational response.
The reason this metric matters more than logins or training completion is that it cannot be easily faked. A user can complete training without learning. A user can log into the system without using it. But a spreadsheet that does real work has to exist somewhere, and an audit can find it.
Three — Reversion Rate
The question: Where is rollback happening, and how fast?
The metric: Percentage of teams that reverted to legacy workflow behavior after a period of demonstrated compliance post go-live. Not non-adoption during go-live. Reversion — the team that adopted, demonstrated compliance, and then rolled back.
Green is below 5% of teams. Yellow is 5% to 15%. Red is above 15%.
This is the transformation equivalent of churn, and it is the most serious of the three signals because it measures the rollback of something that had already taken hold. A team that never adopted is a training and reinforcement problem. A team that adopted, complied, and then reverted is a structural problem. The environment pulled the behavior back.
Reversion happens because pressure builds in places the program did not see. A quarter closes and the old reporting structure is faster. A manager changes and the new manager does not enforce the new workflow. A peak season hits and the team falls back to what they know. The environment did not change enough to hold the new behavior against ordinary operational pressure.
I worked on a sales transformation where adoption hit 89% in the first sixty days. The dashboards were green. The program team began winding down. By day 120, the field sales team in two of five regions had reverted to a workflow that bypassed the new CRM at the deal review stage. The dashboards still reported 89% adoption because the system data was being entered after the fact. The reversion only became visible when the revenue forecasting accuracy degraded enough for finance to notice.
Reversion Rate is what would have caught that in week ten instead of month four.
Why These Three
None of these three measures sentiment, attendance, or activity. They measure operational behavior. They are difficult to game because they are anchored in transactions, audits, and observable patterns rather than in surveys or self-reports.
They are also the three a sponsor with five minutes can absorb. The questions they answer are concrete:
Is the new way actually holding?
Are people still working outside it?
Where is rollback happening and how fast?
The metrics most programs track at the executive level do not answer any of those questions. They answer different questions — questions about whether the program is running on schedule, whether the change management plan was executed, whether stakeholders were communicated to. Those questions have their place. They are not the questions a sponsor should be asking ninety days after go-live.
What Practitioners See That Executives Don’t
The deeper pattern under all three of these metrics is the same. Practitioners on the engagement team can see the operational signals weeks before the executive dashboard moves. They watch user behavior in the system. They hear from the managers in the morning standups. They see the friction patterns and the workaround formations. They know which functions have stopped enforcing the new way.
By the time the executive dashboard shows red, the practitioner team has typically been watching the signals for four to six weeks. The lag between what the practitioner team can see and what the executive dashboard reports is where most transformations quietly fail.
This is not an accident of dashboard design. It is the result of building executive dashboards around activity metrics that update slowly and ignore operational metrics that update fast. The three above update fast. That is why they belong on the executive dashboard.
Apply This to Your Program
If your transformation is past stabilization, the three questions above can be asked tomorrow morning.
Pull your transaction data. What percentage of transactions completed inside the intended workflow path versus through exceptions, manual entries, or post-hoc corrections?
Audit your shadow workflows. Walk your finance team, your operations team, your sales team. Ask what spreadsheets they still use. Count them.
Look at your compliance trend by team. Find the teams that hit compliance in the first sixty days and then fell back. Those are your reversion cases.
If any of those three answers is uncomfortable, you have the same gap most programs have. The dashboard is not telling you what is actually happening operationally. The three signals are.
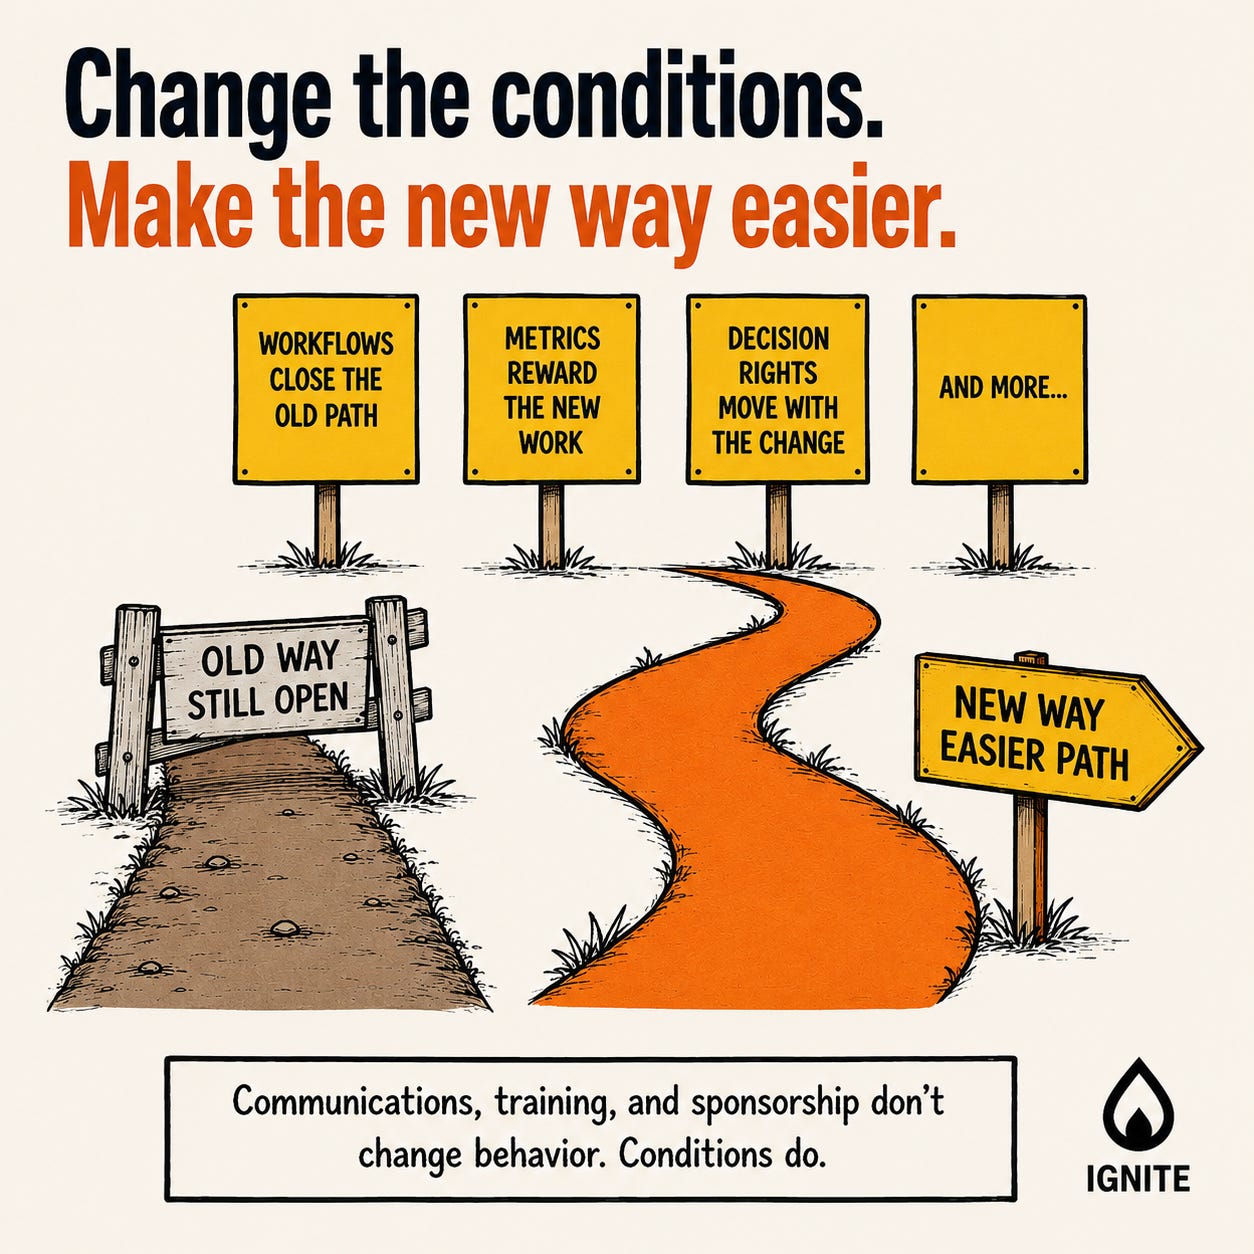
If you run the shadow workflow audit and find more than ten in any single function, the issue is structural. More training, more communication, more sponsor visibility will not close the gap. The conditions around the work are what would.
The structural work to close the gap is harder than the diagnostic work to find it. But you cannot close a gap you cannot see.
Miguel Guevara runs IGNITE Consulting, where he works with sponsors to close the structural conditions that determine whether transformations hold. Author of Cut the Cr*p, available July 7.

Miguel Guevara
📞 Book a 1:1 Planning call with me (Miguel)
👀 Follow me (Miguel) on LinkedIn